Adding feature flags is easy but deleting them requires care and safety. We even mess it up. Before you delete a flag, you have to remove it from the code. If you don't remove it from the code, deleting a flag is the same as disabling it.
But even after removing all the uses in the code, deleting a flag is still nerve-wracking. It's like dropping a column or table in production. Even when you've triple checked, you throw up a bit in your mouth as you hit <enter> on the command or click the button.
When cleaning up a feature flag, you need answers to these questions:
- What is the state of this flag in key environments?
- Did I remove all the uses of the flag from the code?
- Is this flag still being used anywhere?
- Am I deleting the right flag?
The Goal
In order to answer these questions, your app needs instrumentation of feature flag usage. But as I mentioned in my last post on architecture, Cloud is disconnected from your app to preserve your app's availability.
All Flipper.enabled? checks (reads) are local to your app. Cloud is an adapter that wraps your local adapter. It never "phones home" for these reads. This means we have no idea which flags are actually being checked in your app.
In order to know if a flag can be cleaned up, we needed instrumentation in your app to ship the telemetry data to Cloud on a regular basis. So that's what I built.
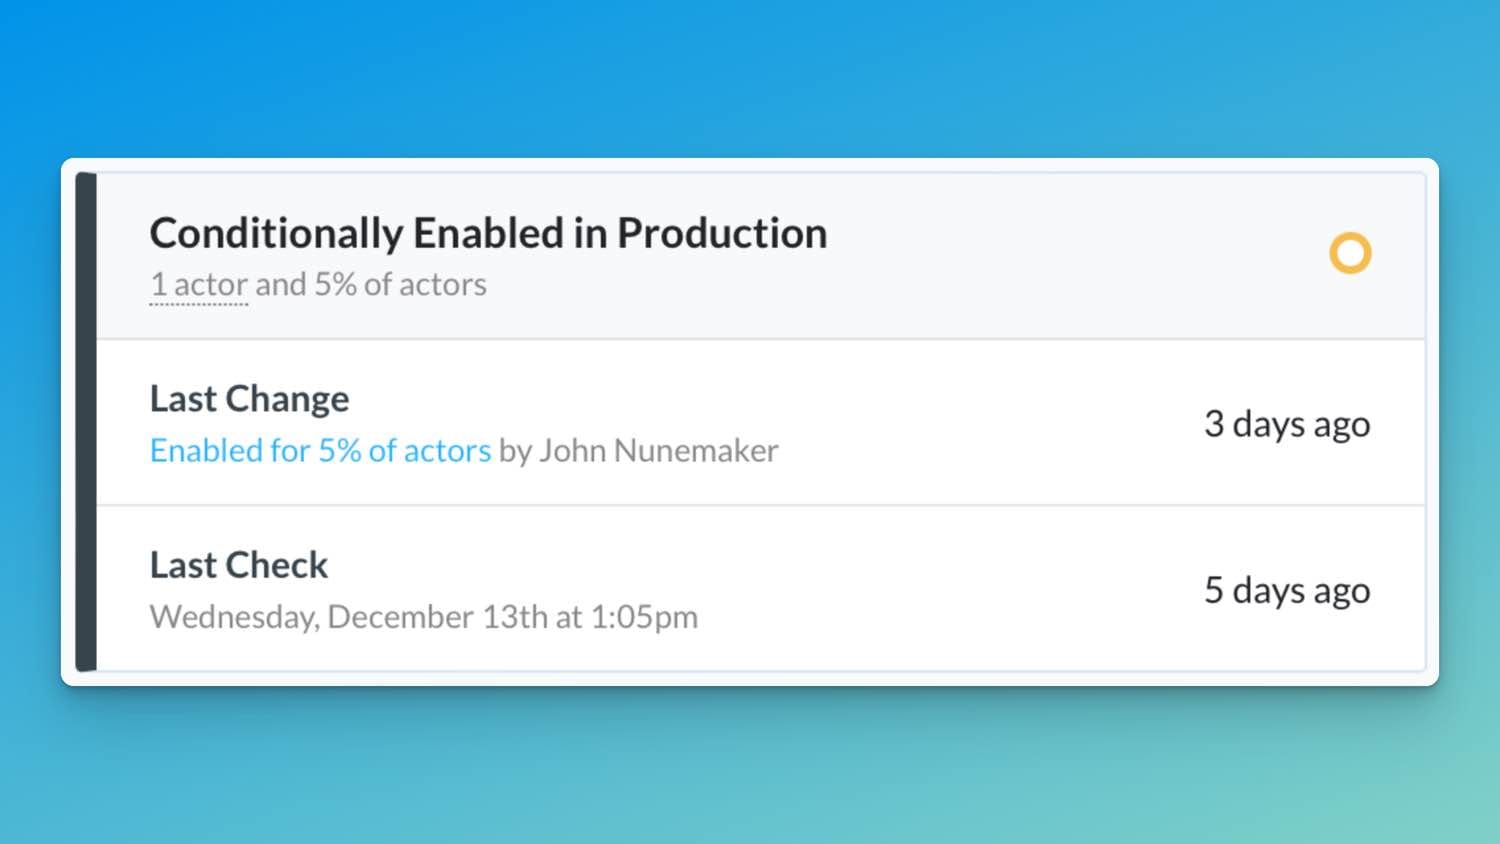
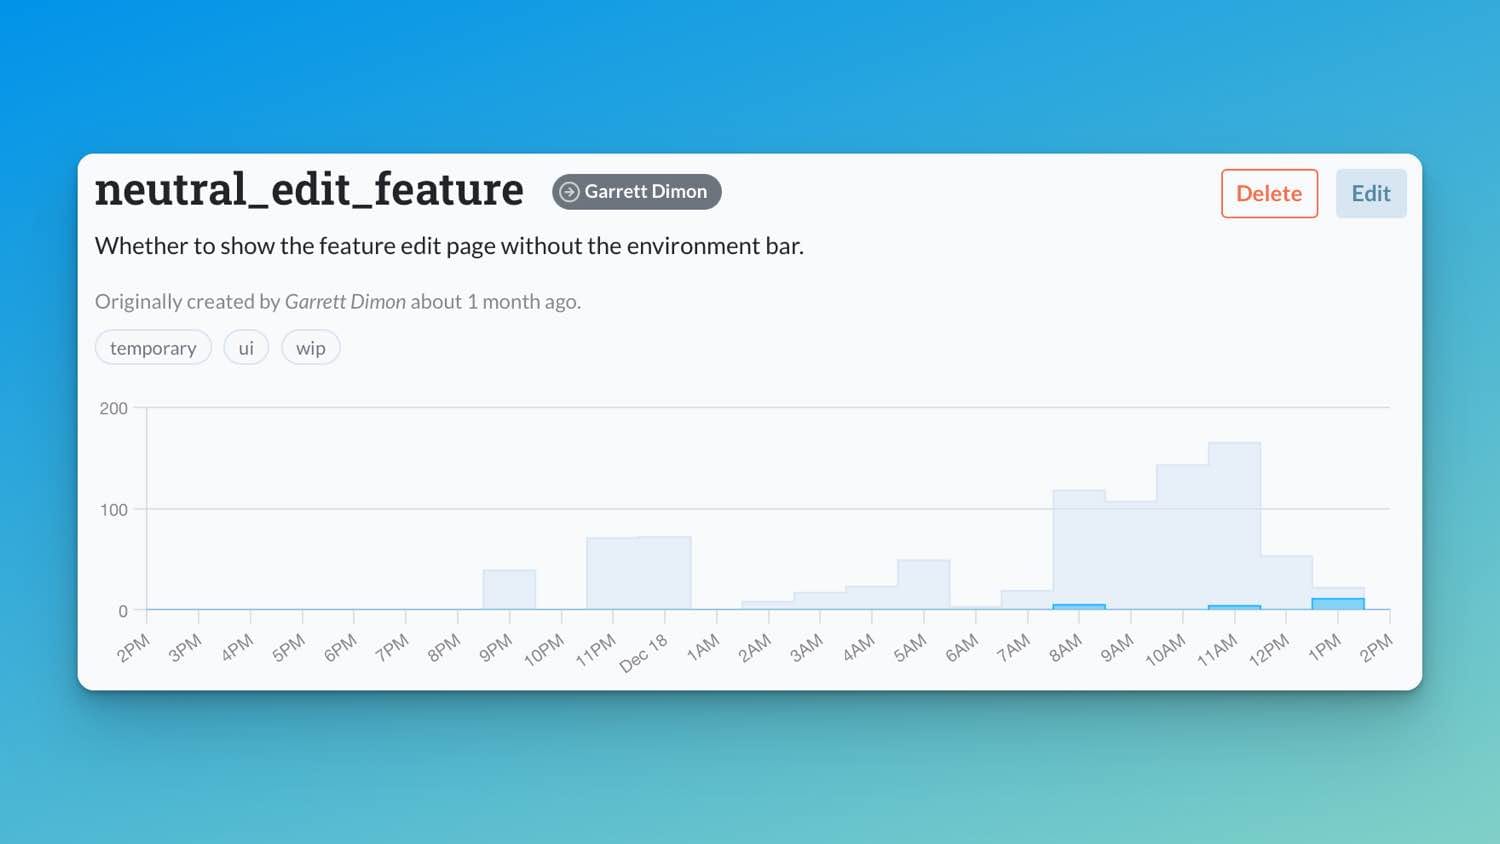
The end goal was summary data per environment/feature/minute. With this data, I can tell you when a flag was last checked in each environment, when it last returned true (or false) and provide a level of confidence that you can safely delete a flag.


Screenshots of last check on feature flag edit/delete and usage over time with true/false results when viewing a feature flag.
The Beginning
My first try was a nested hash of feature, result, minute, and count to store the minute summary data in memory in your app—something that would make it easy to increment the counters and ship + store + query in Cloud. Something like this:
{
  :search => {
    true => {minute => 23},
    false => {minute => 23},
  },
  :new_feature => {
    true => {minute => 1},
    false => {minute => 32},
  },
}Thread Safety, Efficiency and Complexity
This nested hash created challenges with thread safety, efficiency and complexity. I wanted the storage of these metrics to be thread safe, as that would be accurate and more efficient for people using systems that supported threading (e.g. puma, sidekiq, good job, etc.).
Anyone with 5 puma request threads could have one instance of metric storage that all 5 of those threads share. This also ensures the telemetry only phones home once (efficient) for all 5 threads every N seconds instead of five times (not efficient) every N seconds. Fewer HTTP requests for the customer and our backend API is a good thing.
I reached for Concurrent::Map because it's used a bunch in Rails and that's the majority of our customer base. The safe way to add a key/value pair to Concurrent::Map is compute_if_absent. I knew this from previous usage in Flipper for our background poller. And let me tell you, nesting Concurrent::Map's gets super awkward/complex real quick.
@storage = Concurrent::Map.new { |features_hash, feature_key|
  features_hash.compute_if_absent(feature_key) {
    Concurrent::Map.new { |minutes_hash, minute|
      minutes_hash.compute_if_absent(minute) {
        Concurrent::Map.new { |values_hash, value|
          values_hash.compute_if_absent(value) { Concurrent::AtomicFixnum.new(0) }
        }
      }
    }
  }
}
That's when I remembered that you can use whatever you want for a hash/map key in Ruby. Creating my own class for the key meant I could have a single Concurrent::Map instead of nesting them.
The Metric
I should have reached for this immediately, but we can't all be smart. In order to make this more simple, I created a Metric class to function as the key, knowing that the value would be a Concurrent::AtomicFixnum.
class Metric
  attr_reader :key, :time, :result

  def initialize(key, result, time = Time.now)
    @key = key
    @result = result
    @time = time.to_i / 60 * 60
  end

  def eql?(other)
    self.class.eql?(other.class) &&
      @key == other.key &&
      @time == other.time &&
      @result == other.result
  end
  alias :== :eql?

  def hash
    [self.class, @key, @time, @result].hash
  end
endThe key method in there is hash, which informs Ruby how to use this class as a key in a Hash or member of a Set. I also defined eql? because different objects can have different hash values even if they are the same.
I'm sure there are a lot of different ways to do what I'm doing here, and likely better ones, but Metric + Concurrent::Map get the job done. With their powers combined, I could do something like this:
# setup storage to default values to Concurrent::AtomicFixnum
storage = Concurrent::Map.new { |h, k| h[k] = Concurrent::AtomicFixnum.new(0) }

# Flipper.enabled?(:search, actor) returned true so...
storage[Metric.new(:search, true)].increment

# now Flipper.enabled?(:search, actor) returned false so...
storage[Metric.new(:search, false)].increment

# Flipper.enabled?(:new_feature, actor) returned true so...
storage[Metric.new(:new_feature, true)].increment

# now Flipper.enabled?(:new_feature, actor) returned false so...
storage[Metric.new(:new_feature, false)].increment
Now I had a map built up of several features with the number of true/false counts in a given minute. Aaaaaaaaaand if you go way back to the high level overview of what I'm building from the beginning of this post, that is exactly what I needed. The only thing left was to tidy this up.
The Storage
To clean house a bit, I created a MetricStorage class where I could tuck some other stuff for convenience. Some of it is not pictured in the sample below, but I'll talk more about those bits in later posts.
class MetricStorage
  def initialize
    @storage = Concurrent::Map.new { |h, k| h[k] = Concurrent::AtomicFixnum.new(0) }
  end

  def increment(metric)
    @storage[metric].increment
  end
end
With this addition, things are getting better:
storage = MetricStorage.new
storage.increment Metric.new(:search, true)
storage.increment Metric.new(:search, false)
storage.increment Metric.new(:new_feature, true)
storage.increment Metric.new(:new_feature, false)
That feels nice, right? At this point, I could track the feature, result, minute and count in a thread safe way. With these metrics alone I can answer questions like:
- When was this feature last checked in the last few minutes/hours in production (or any other environment)?
- Is this feature fully enabled and always returning true? Maybe time to clean it up (unless it's a circuit breaker of some sort).
- Is this feature fully enabled but never being checked in production? Maybe time to clean it up (seems like it was removed from the code).
- Is this feature disabled and never being checked? Maybe it's stale and can be removed.
- Is this feature actually enabled for near 50% of the time when I enable percentage of time for 50%?
- How often is this feature being checked in production over time?
Those are a lot of useful questions to be answered.
The Hook
Now that I had storage, I needed to use it, which meant I needed to hook into when Flipper.enabled? was called and increment the correct metric.
Thankfully, Flipper comes with support for instrumentation via ActiveSupport::Notifications. By default, Flipper uses a noop instrumenter that does nothing (I'm sure there is a name for this pattern because I do it all the time). Every time Flipper::Feature#enabled? is called, the instrumenter is called as well. That's my hook.
I know people can use ActiveSupport::Notifications or nothing. So instead of forcing the use of AS::Notifs for this to work, I just created an instrumenter to wrap whatever instrumenter is being used. This is similar to how some adapters in Flipper wrap other adapters (say for memoizing, caching, instrumenting and more).
require "delegate"

module Flipper
  module Cloud
    class Telemetry
      class Instrumenter < SimpleDelegator
        def initialize(cloud_configuration, instrumenter)
          super instrumenter
          @cloud_configuration = cloud_configuration
        end

        def instrument(name, payload = {}, &block)
          return_value = instrumenter.instrument(name, payload, &block)
          @cloud_configuration.telemetry.record(name, payload)
          return_value
        end

        private

        def instrumenter
          __getobj__
        end
      end
    end
  end
end
The Flipper::Cloud::Telemetry::Instrumenter wraps whatever instrumenter is being used. If you haven't used SimpleDelegator, that's what it does. All methods called will be sent to what is passed to super in initialize.
I then override the instrument method to call the original instrumenter's instrument method, record the telemetry and return the same thing as the original call. Just like that we've hooked into the existing instrumentation, be it ActiveSupport::Notifications, Noop or whatever else in a mostly invisible way.
You'll note I glossed over @cloud_configuration and telemetry#record in this post. I'll save that for part 2. But inside of record is where the MetricStorage instance gets incremented.
The Summary
Ok, we just covered a lot of ground, so let's summarize real quick.
- The goal was minute summary data for features.
- I started with a
Metricclass to storekey,resultandminute. - I used
Concurrent::MapwithMetricas key andConcurrent::AtomicFixnumas value to store metrics in memory in a thread safe way. - I made a new instrumenter that increments
MetricStoragefor aMetricwhenFlipper.enabled?is called by wrapping the provided instrumenter in a mostly invisible way.
Now that I have metrics stored in memory, I need to phone home with these metrics on a regular interval and ensure that the memory those metrics use doesn't grow indefinitely.
That's what I'll cover in part 2, along with some forking. Be sure to subscribe below to follow along.